Luscinia
Bioacoustic analysis of field recordings
Project maintained by rflachlan Hosted on GitHub Pages — Theme by mattgraham
Welcome to Luscinia!
This is the website for Luscinia: software for bioacoustic archiving, measurement and analysis.
Luscinia is written and maintained by Robert Lachlan, in the Department of Biological and Experimental Psychology, in the School of Biological and Chemical Sciences at Queen Mary University of London.
Details and a manual about it can be found on its wiki.
It can be downloaded from the releases page.
What is Luscinia for?
Archiving scientific wildlife recordings.
Luscinia is built using the H2 database engine. Songs, calls and utterances are stored in databases - that is, their audio files, metadata about where they were recorded, who made them, etc, and measurements of their acoustic properties are all stored in the same easy-to-back-up place.
Measuring wildlife recordings.
Luscinia provides a flexible, fast and reliable way to semi-automatically measure bioacoustic signals. It measures 15 acoustic parameters as contours and hierarchical information about how complex signals are structured.
Analysing bioacoustic signals.
Luscinia implements a wide range of analytical methods, from exporting summary statistics to spreadsheets to its centrepiece: and advanced implementation of the dynamic time warping algorithm. This allows the comparison of disparate and complex signals, and forms the basis for a range of bioinformatic and statistical analyses: multidimensional scaling, dendrograms, geographic analysis, syntax analysis and more.
Luscinia has currently been used in more than 20 publications and is actively supported and developed.
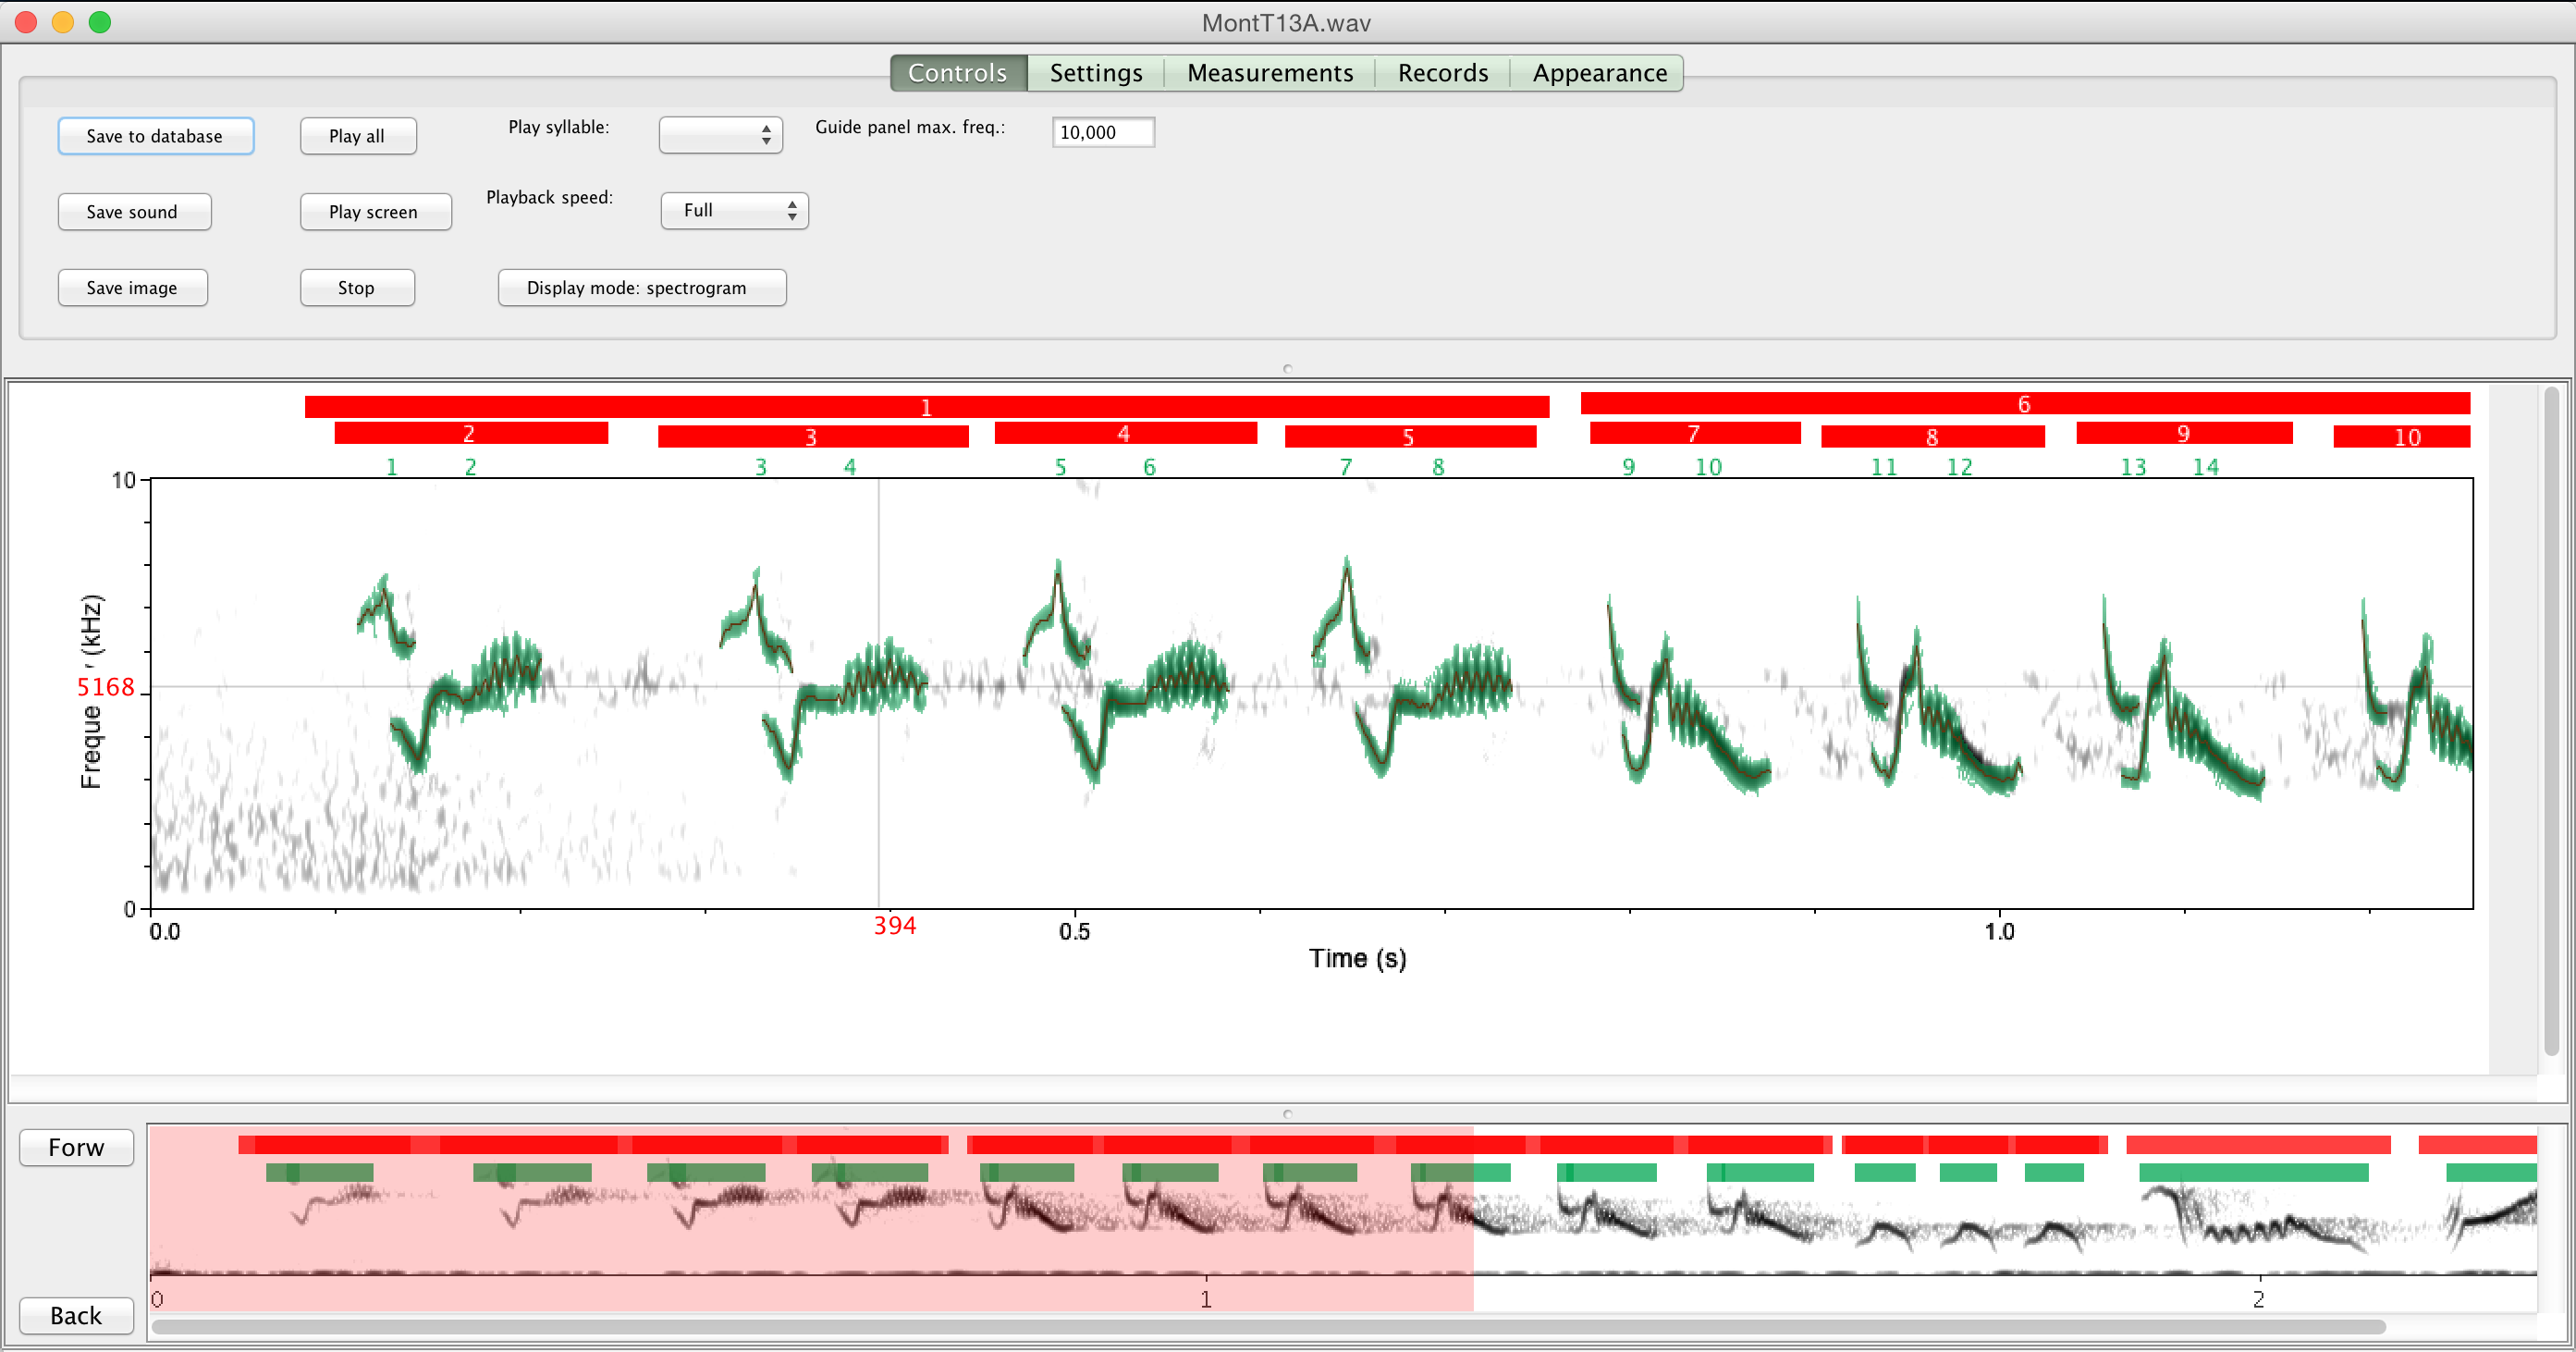
Spectrogram screen. Users can navigate in the lower "Navigation panel", and measure song elements in the main window. Luscinia provides a fully-featured spectrogram view with a flexible, semi-automated and efficient method to measure songs.
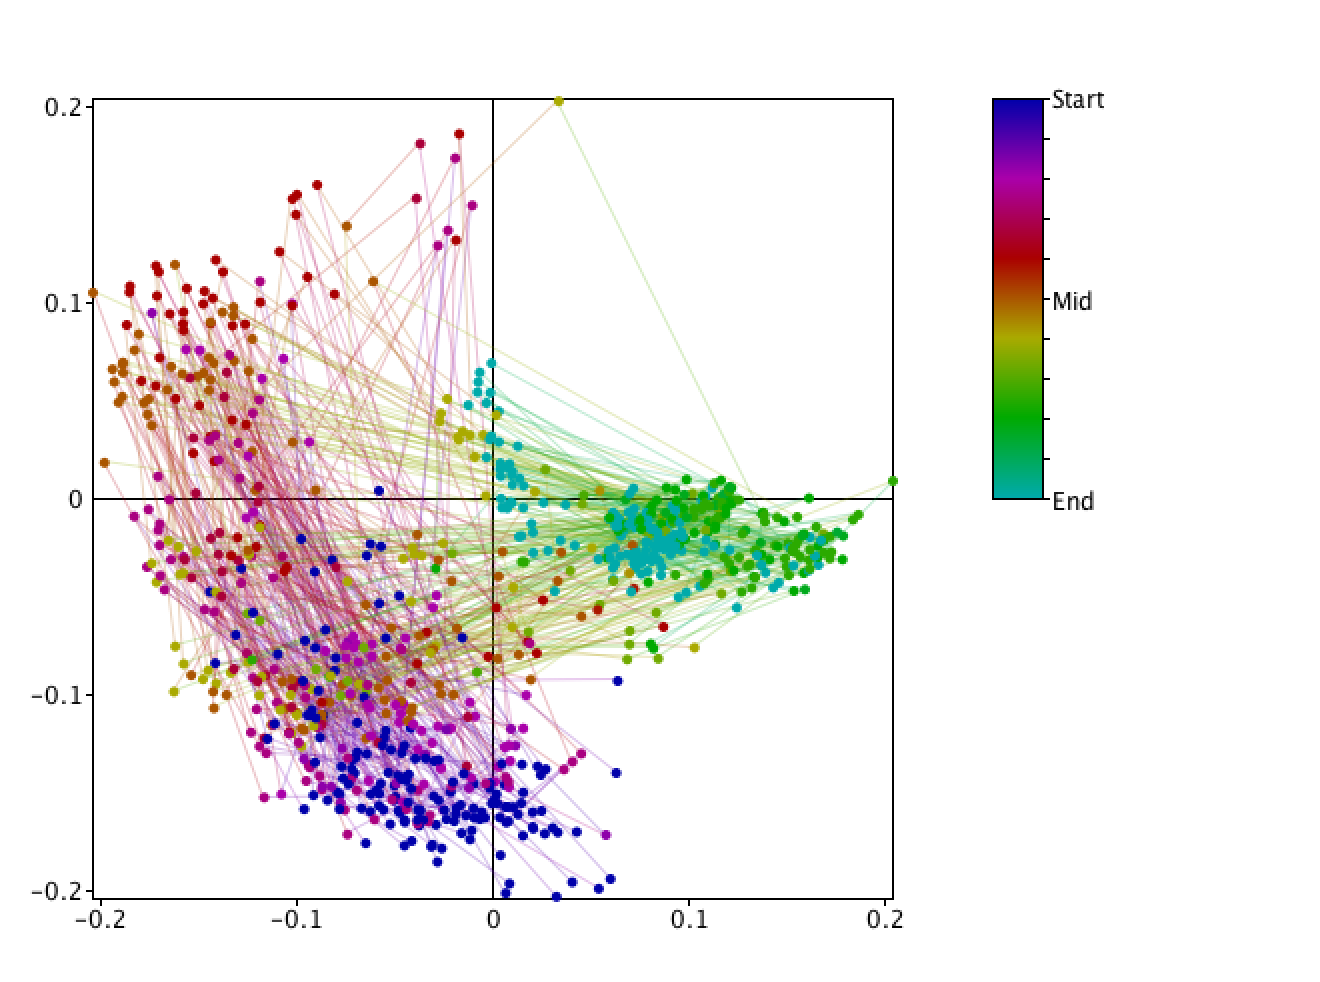
MDS plot of chaffinch syllables from a whole-population sample. Each dot represents a syllable, and its colour represents its position within a song. Lines connect adjacent syllables within a song.
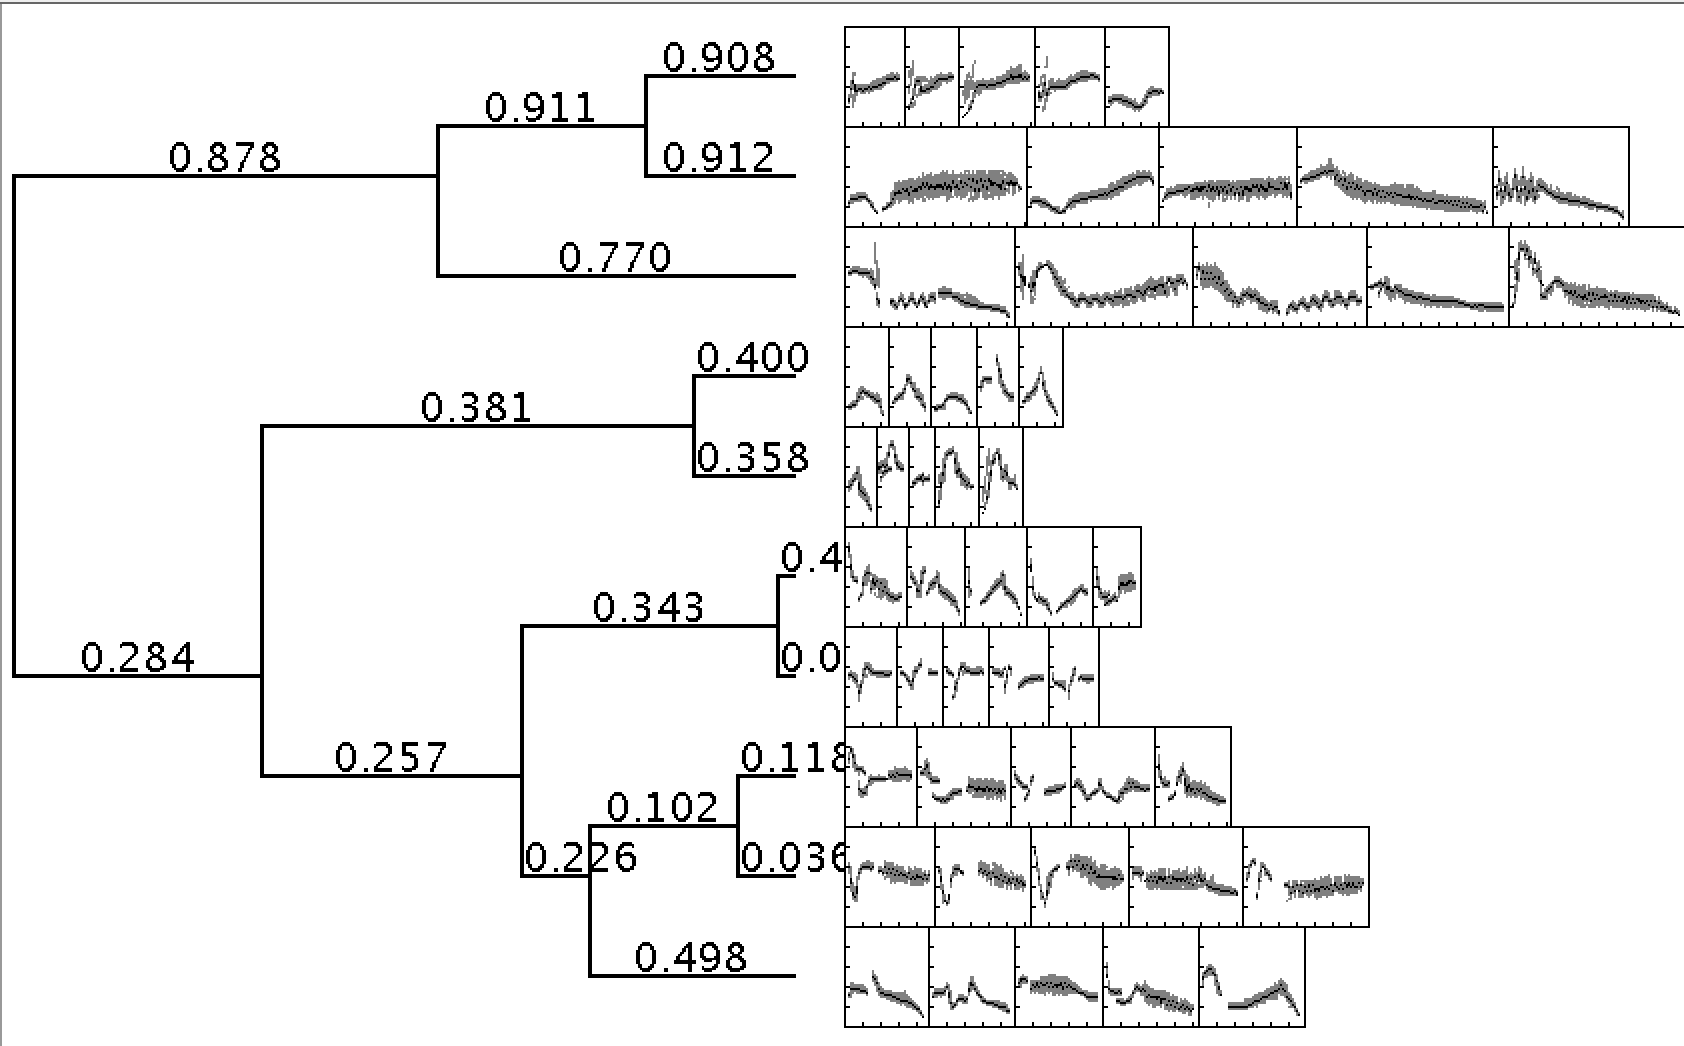
Dendrogram of chaffinch song-types.